


Jul 24, 2025
Nov 19, 2025
How to Model Enterprise Operational Risk
.svg)

.svg)
Key Takeaways
- Simple Model, Big Upgrade: A very simple, fully prescribed quantitative model can replace traditional risk matrices while fitting into existing ERM meetings, data, and workflows.
- Three Numbers per Risk: By focusing on frequency of occurrence, average loss per event, and a credible downside, CROs can build an enterprise-level loss distribution that supports real decisions.
- Aligning Risk with Decisions: Aggregated risk metrics can be mapped to governance structures like business units, risk categories, and product lines to inform budgeting, portfolio moves, provisioning, and targeted transformation.
- Tail Risk as a Compass: Infrequent but severe risks drive volatility and “bad year” outcomes, helping leaders avoid cutting controls that don’t change expected loss much but materially protect the tail.
- From Compliance to Value: Even crude SME estimates fed into a simple model in Excel turn risk registers from heat-map compliance artefacts into actionable insights on where to spend, save, invest, or divest.
Deep Dive
In this article, Graeme Keith explores how enterprise leaders can move beyond traditional risk matrices and adopt a simple, quantitative approach to modeling operational risk across complex organizations. By breaking down how to structure uncertainties, estimate losses, align assessments with decision-making, and aggregate risks into meaningful enterprise-wide insights, he illustrates how even basic quantitative inputs can transform the usefulness and credibility of enterprise risk management programs.
Turning Operational Risk Into Decision-Ready Insight
Over the last few articles, I have been building up a kind of modeling manifesto: starting with What is a risk model and Why model risk and, after a brief interlude extolling the virtue of simplicity, culminating last week with how to model risk.
The measure of a model is its usefulness, and a model isn't useful if it isn't used. Models are useful if they are actionable and fit for purpose, but they are only used if they are built in to the decision context of the risk owner making decisions with the model. The owner of the risk has to own the model.
As a CRO, you are responsible for for the quality of risk management at the level of individual risk ownership and modeling should be an essential part of your toolkit. But you are also a risk owner yourself. You are accountable for the risk in the organization (if not all the risks) and supporting the enterprise-level, strategic decisions pertaining to the management of that risk. Where should we spend? Where can we save? Where to invest? Divest? How the head of safety spends her money on managing safety is her business, but if ERM has any value it's informing the decision to spend money on safety rather than, say, cyber.
To understand enterprise risk, we have to understand the individual risks that impact the entire enterprise—things like market prices, interest rates, inflation and so on - and we have to understand the risks that are managed across the organization—the operational risks that taken individually may seem so unlikely or mild as not to move the needle on risk at an enterprise level, but when taken as a whole constitute both a substantial exposure, but also a significant opportunity.
The former is eminently well suited to the kind of modeling approach I have been advocating. So, in fact, is the latter, but the results of doing so land remarkably close to standard ERM practice, meaning it is possible gain the objective insights of a quantitative risk model with very little modification to existing ERM processes and workflows.
The only way to manage risk, at any level, is to structure our understanding of the uncertainties that stand between our decisions and the objectives they influence, i.e. to build a model. So what does this enterprise scale model look like? And how we can use that model to construct an alternative to the risk matrix?
The Model
The challenge is to build a model that is simple enough at the level of the individual risk that the people who today assess risks using risk matrices are able to provide meaningful input to that model using the same data in the same meetings under the same workflows, while at the same time ensuring that the results of that model are robust enough to support the decisions that model is designed to support.
Scope
We exclude risks that impact at an enterprise scale—market prices, interest rates, inflation. These are best modeled individually, which is always worth the effort as the impact of these risks is so critical. What's left are operational risks—risks whose management is delegated out through the organization, risks that are managed locally, on the ground, but whose aggregated losses impact on an enterprise scale. These are the risks that are captured and catalogued in a risk register, typically with a risk matrix assessment.
Looking to replace risk matrices, we're looking at uncertainties where it makes sense to ask, "How often does this happen?" or, "How likely is this to happen?" and "How bad is it when it does?". So we're only looking at uncertainties that depend on the occurrence of an event.
Objectives
We're looking at operational risks and our primary concern is economic loss—additional costs or reductions in revenue—and their effect on the bottom line. So our primary objective is some measure of profit.
When considering losses, the total impact of multiple risks is found simply by adding the individual impacts. This is a key requirement for the method by which we will synthesize individual assessments to generate both an understanding of the distribution of risk across the enterprise, as well as individual risks' contribution to the overall risk profile.
We can also look at other additive metrics—lost time incidents and fatalities in a safety context, for example, number of customers in a commercial context, production in extraction and manufacturing contexts. I can also introduce additive utility scales to capture other dimensions of impact like environment and reputation. These allow me to extend the objectives under consideration to include safety and various strategic objectives, but the point of departure is the effect of risks on the bottom line of our P&L.
Decisions
We are not here meddling with the management of individual risks. Our decision levers are at enterprise level and are four-fold:
- Budget: The distribution of resources to specific business units, product lines, functional areas, and so on, in order to spend money where it makes a difference and save money where it doesn't.
- Portfolio: Selling out of businesses whose exposure to potential loss isn't warranted by the profit they're chasing.
- Provisioning: Ensuring capital is available, for example, to assure project success at a portfolio level.
- Targeted transformation: Investments in changes in practice. For example, global endeavors to improve driver safety.
Targeted transformation requires us to be able to prioritize risks coherently and correctly.
Budget, portfolio and provisioning all require us to align our model with the governance structures in place for portfolio management and for distributing resources across, for example, business units, functional areas responsible for different risk categories, or for different processes for protecting value and product lines. We will assume that these structures are in place and are coherent in the sense that any potential loss can be assigned to one and only one place in each structure.
Aligning enterprise-wide risk assessments to enterprise level decisions then simply becomes a question of assigning the risks to these structures and then adding all the risks belonging to, say, a business unit or a risk category or a product line together.
We can track the resulting metrics through time, we can investigate how much different control strategies change exposure, we can examine differences in exposure under different scenarios and, crucially, we can compare business units, risk categories and product lines to each other in order to determine, for example, where we should invest and where we might save.
The Model
The decision-actionable insight we are looking for from this model is in the aggregated loss from a large number of risks or the individual contribution to this aggregated loss from individual risks.
While any given risk may or may not occur and may have a wide range of loss outcomes if it does occur, when you aggregate a number of risks together, some of them occur, some of them don't, and some of those that occur come in high, and some low. As we add more and more risks, these variations tend to cancel each other out and the resulting uncertainty becomes less and less volatile (relatively) and more and more smooth. All the individual gnarly detail of each risk gets washed out in the addition and we're left with an uncertainty that is relatively accurate, smooth and completely described by the broad features of its shape: the average loss, the amount of volatility and the skewness—which roughly speaking captures how much worse bad outcomes are than ordinary outcomes.
Because the detail of individual uncertainties is lost in the aggregation wash and we are only really interested in the aggregation, we don't need to care very much about the details of individual risk assessments. We need only to capture risks' contribution to the numbers that describe the final aggregated distribution: the average, volatility and skewness. There is some subtlety in choosing a very simple model aligned with very simple questions aligned with the intuition of subject matter experts that captures exactly the relevant information, but ultimately the risk model boils down to three clear and simple questions:
- How often, on average, does the risk occur annually
- When the risk occurs, we recognize there can be a large range of outcome losses: Where is the middle of that range? And what is a credible downside to that range?
These questions replace the heat map.
It turns out that we can further simplify these questions and merely ask what, on average, we lose whenever the risk occurs. The best way to estimate that average is to provide the range described above, but as a starting point, a simple rate and average loss gets you a huge amount of additional insight.
It has to be the average loss (and not a worst case or a most likely) because this is the information we need to construct something we can meaningfully add. The key transition is asking about real-world, objective quantities that you could in principle measure and thinking about rates and losses, rather than just how we feel about likelihoods and impacts.
The Model in Action
Evans Enterprises (made-up company) has replaced its heat map assessments with this very simple quantitative assessment methodology. Evans is a multi-national company with a number of divisions covering oil and gas exploration and production, mining, weapons manufacture and water utilities.
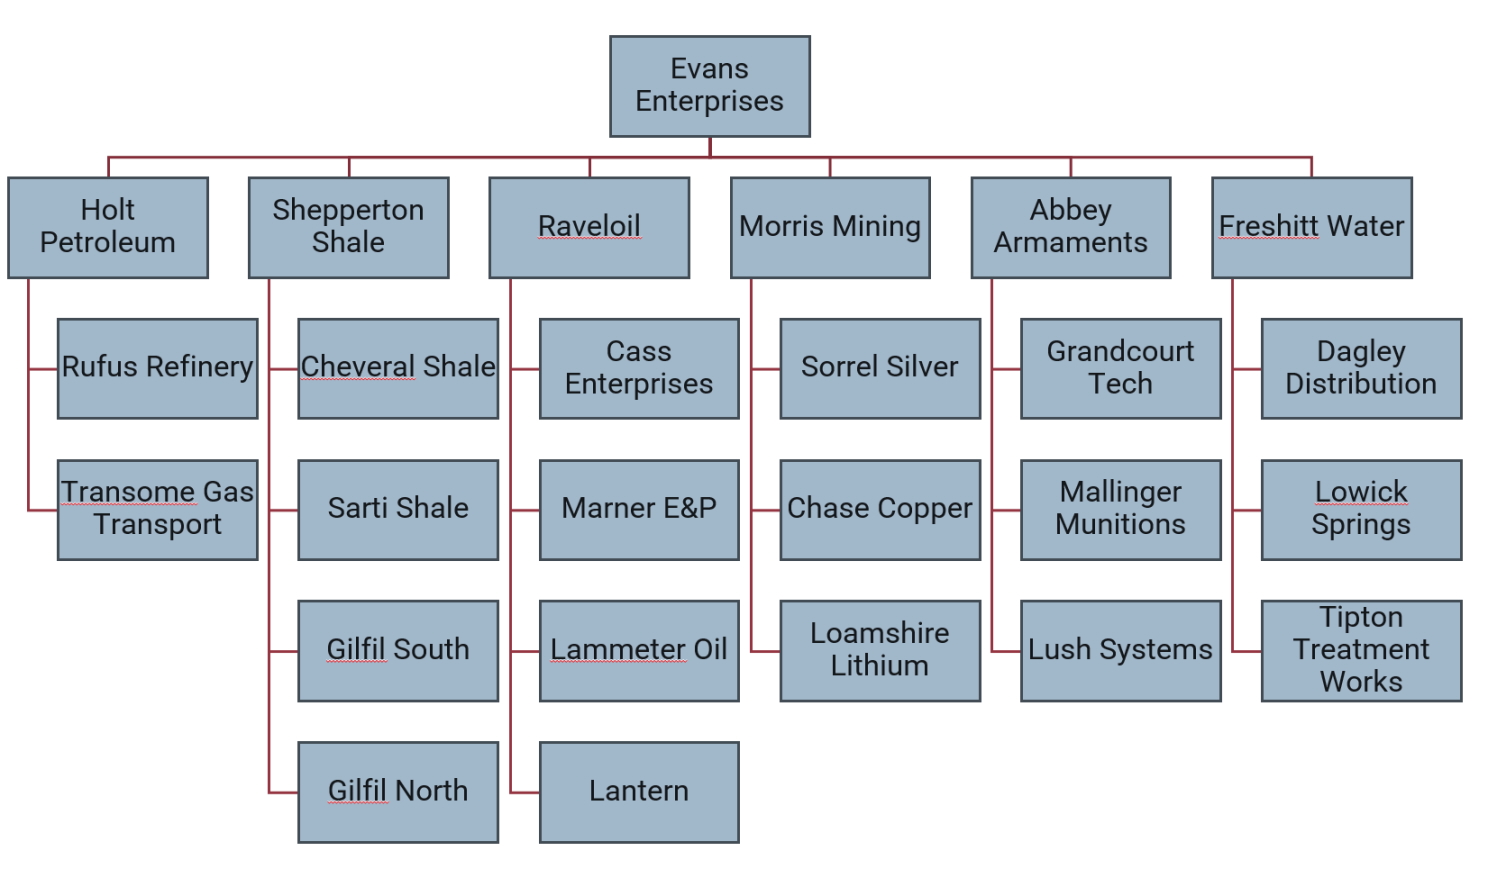
Risks are assessed across the organization and assigned both to the business unit (or division) in which they are managed and also to a risk taxonomy.
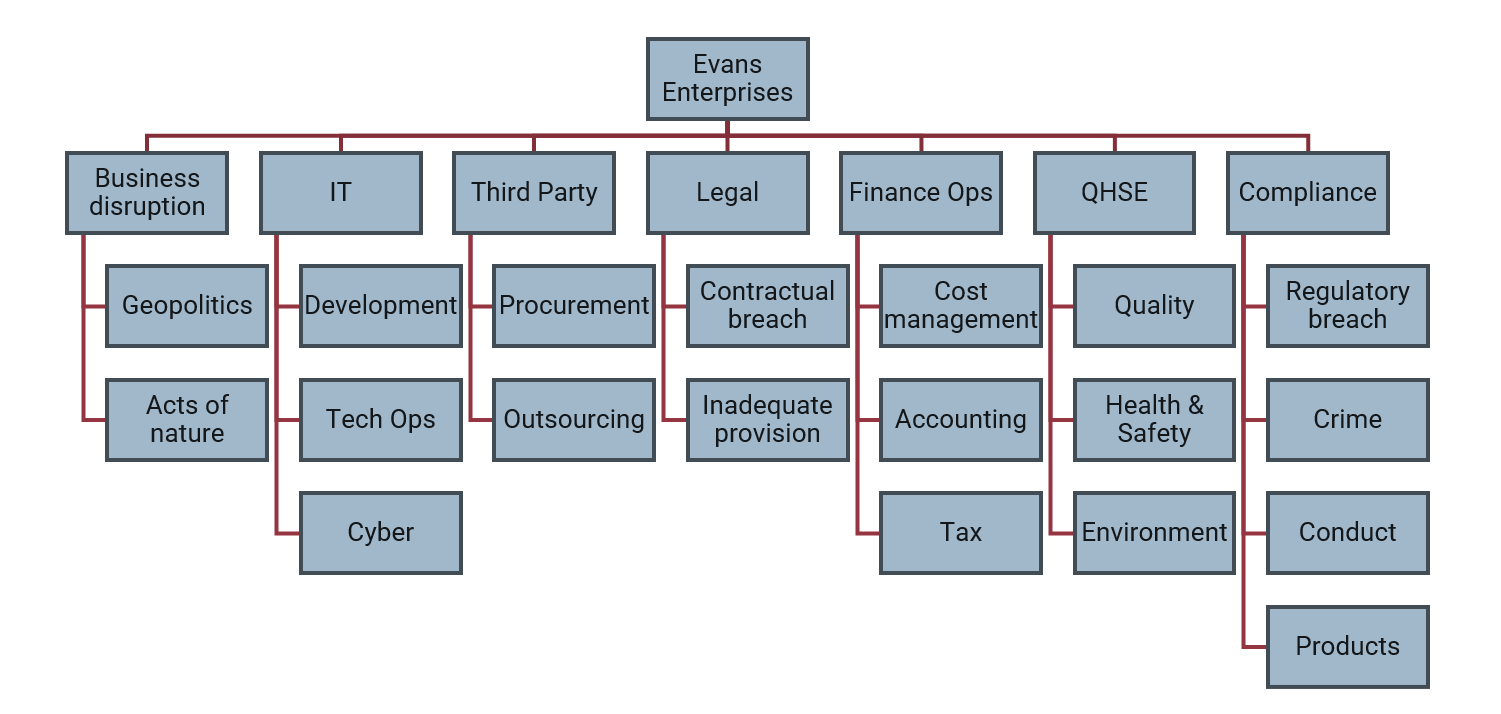
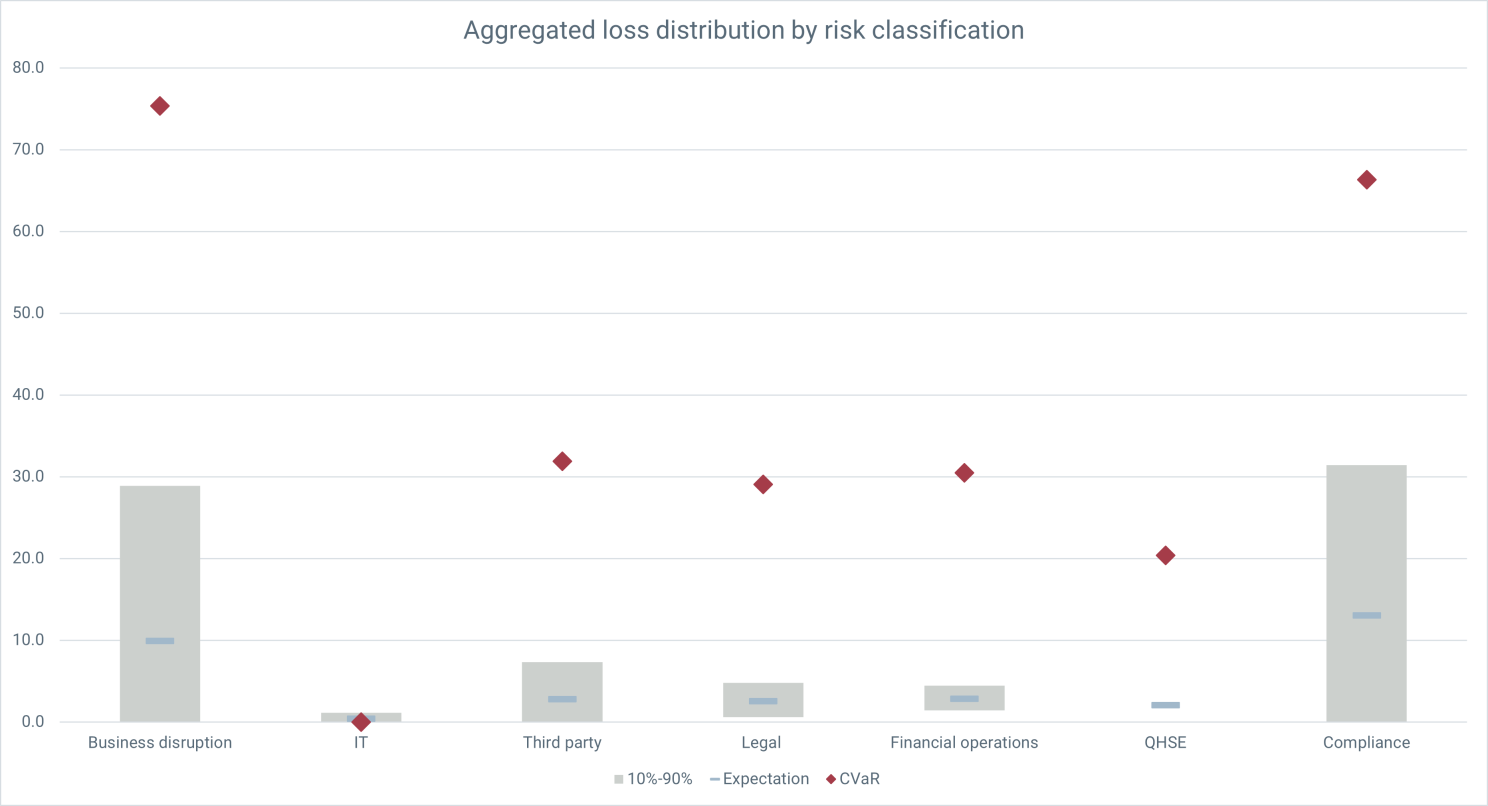
To compare, for example, the risk exposure across risk categories, we add up all the risks under business disruption (in all the business units) and compare that to the sum of all the risks under IT (in all the business units) and so on.
We're actually adding uncertainties here, and even if the aggregated uncertainty is smaller (relatively) than the uncertainty on the constituent risks, the result is still itself an uncertainty. Normally, we'd use Monte Carlo simulation for this, but because of the simplicity of the model we can do this analytically—these results are all produced in vanilla Excel and the difference from a Monte Carlo result is negligible.
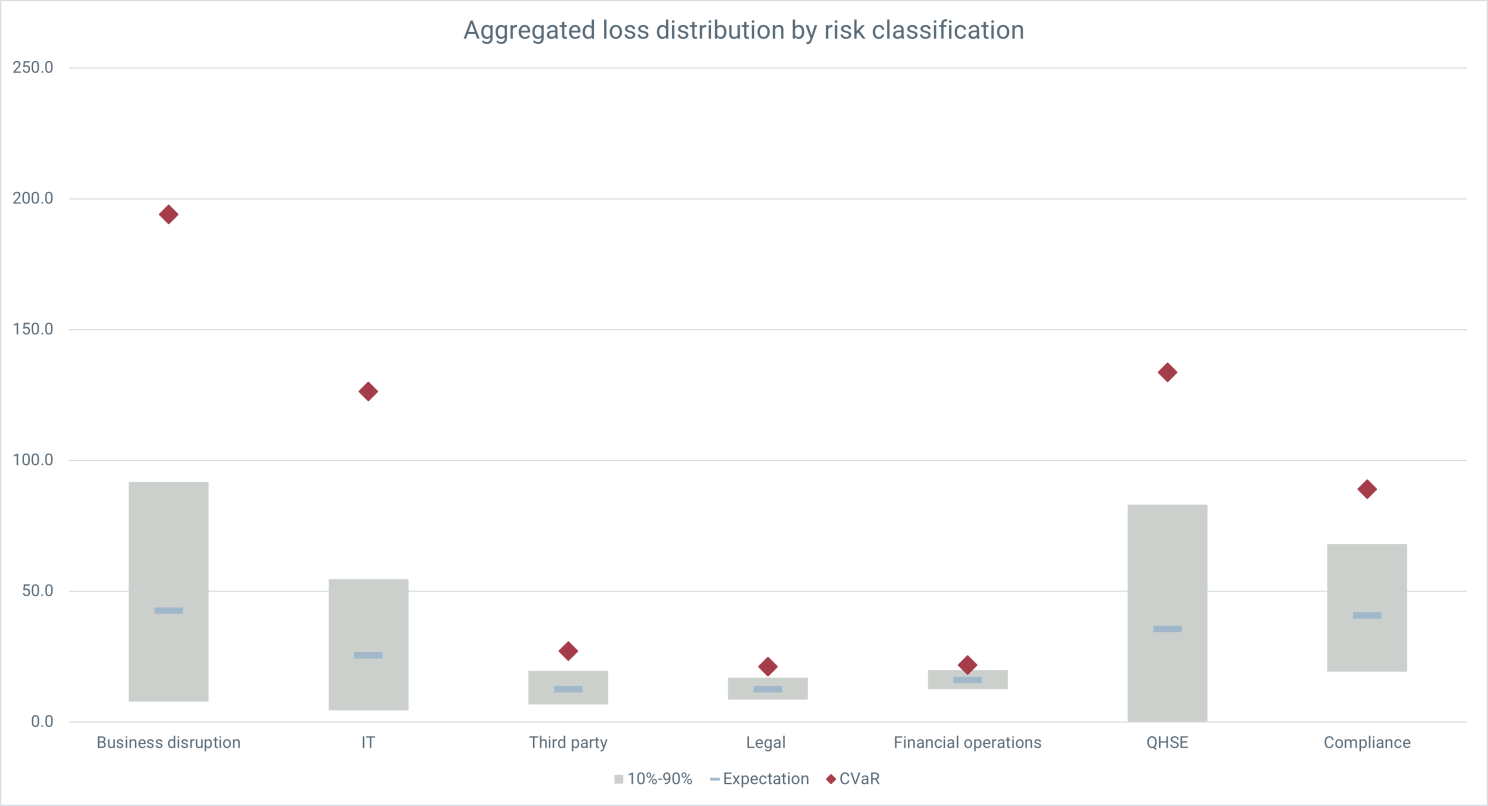
We can see in this figure both the expected loss (blue dash—a probability weighted average of all the potential loss outcomes), but also the range of losses (the grey blocks are showing an 80% confidence interval) as well as the average of the worst 10% of loss outcomes (red diamond), which we use to measure what a bad year looks like for each category.
We can see, for example, that although Compliance loses, on average, more than QHSE, the losses are more predictable and the tail risk—a bad year—isn't as bad.
Now the model has no account of the correlation between risks, so while the expected losses might be reasonably robust—at least good enough for making comparisons—we should take the volatility with a pinch of salt in absolute terms. Nonetheless, the tail risk is providing us important, decision-actionable information about the risks in each category.
Risks that don't happen very often, but that hit hard when they do, contribute more to volatility and tail risk than risks that happen often, but that hit mildly. This is important because we might be controlling a risk, not because it's costing us year on year, but because in the event it does go south, it would otherwise hit us very hard. Keeping an eye on the tail prevents us from saving money on controls that don't effect expected losses, but that do effect the tail.
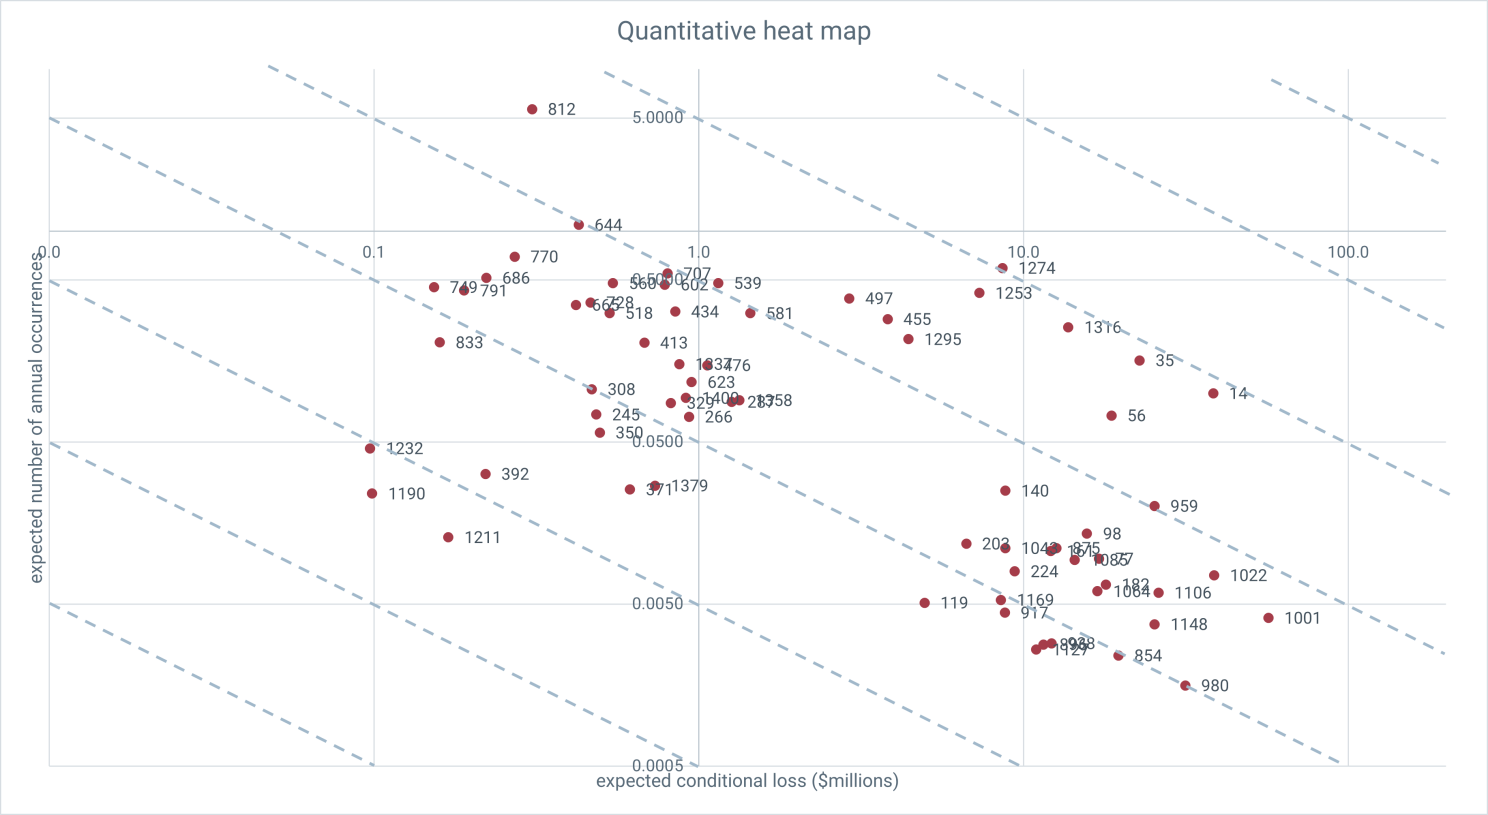
A way of seeing this at individual risk level is to plot the average rate at which risks occur against the average loss they incur when they do.
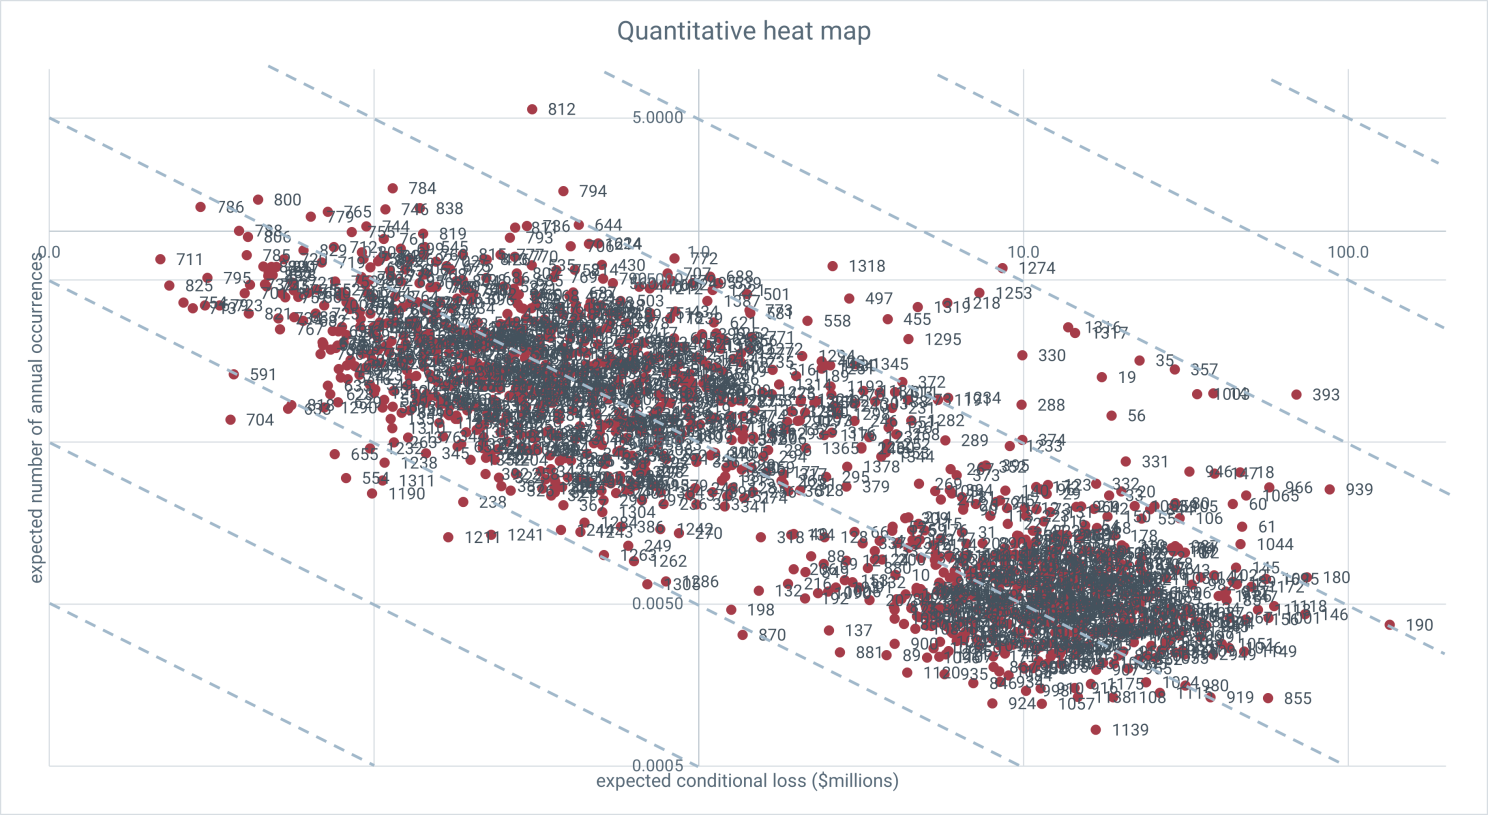
When these are plotted logarithmically, the blue dashed horizontal lines correspond with lines along which the annual expected loss is constant. On a given line, the risks to the upper left are the high rate, low impact that move the needle on average losses in the aggregate, but not so much on the tail. The lower right contribute disproportionally to the tail.
This figure has all Evans' risks, but it is a simple matter to filter for a given business unit or risk category. Say I was the managing director of Chase Copper—a business unity in Evans' mining division. Filtering for Chase's risks, the quantitative heat map looks like this, with the numbers corresponding to an easily searchable and sortable list of risks.
The comparison between risk categories now looks like this:
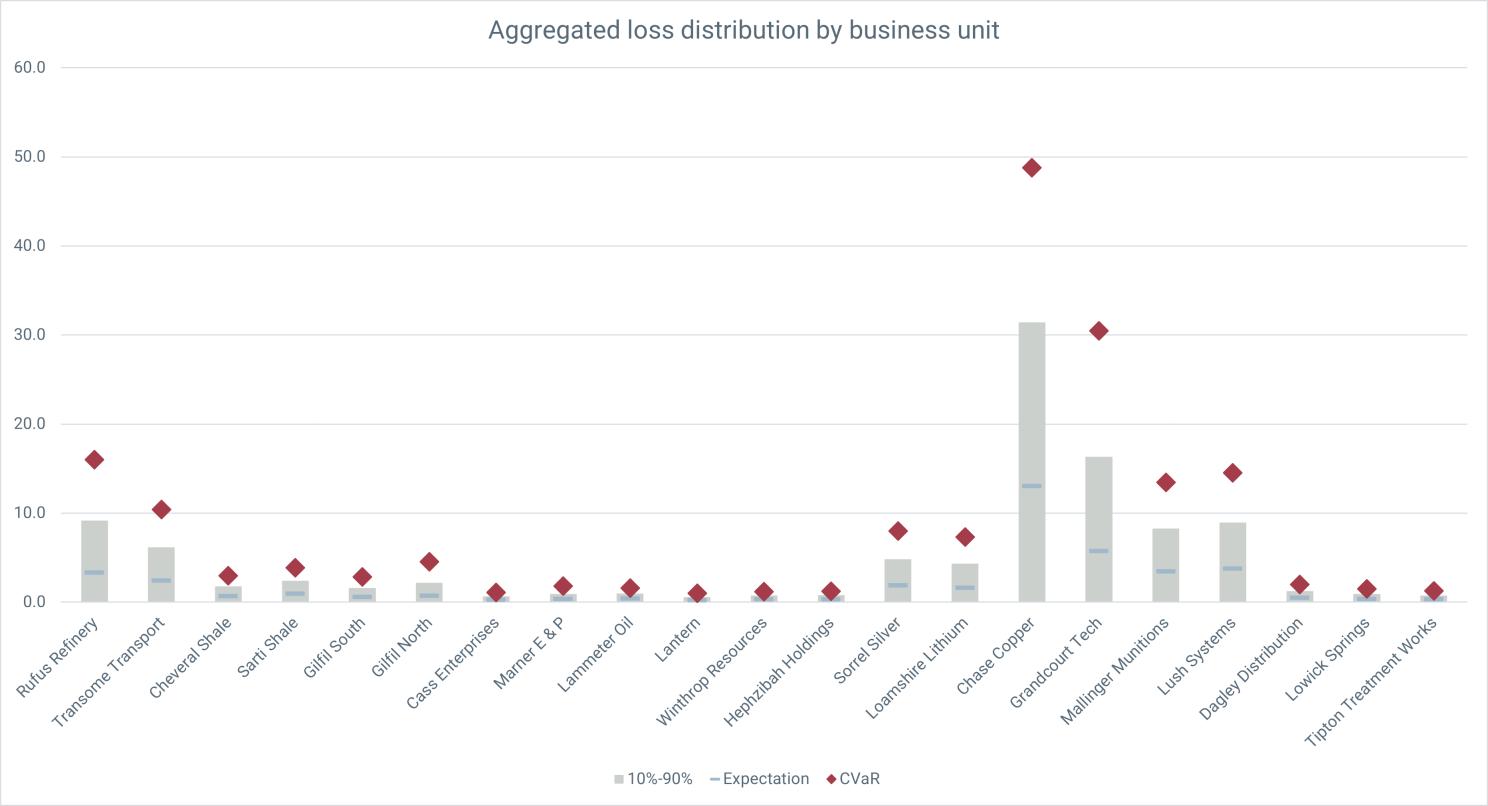
Chase clearly has some compliance issues (although it's much less sensitive to cyber risk than the company as a whole). If we wanted to see how Chase compared on Compliance with the other business units in the mining division, we can filter for Compliance risks and look across the business units:
Yep, Chase really has an issue with Compliance. To see where that's coming from I can filter on Chase and look across the risk sub-categories.
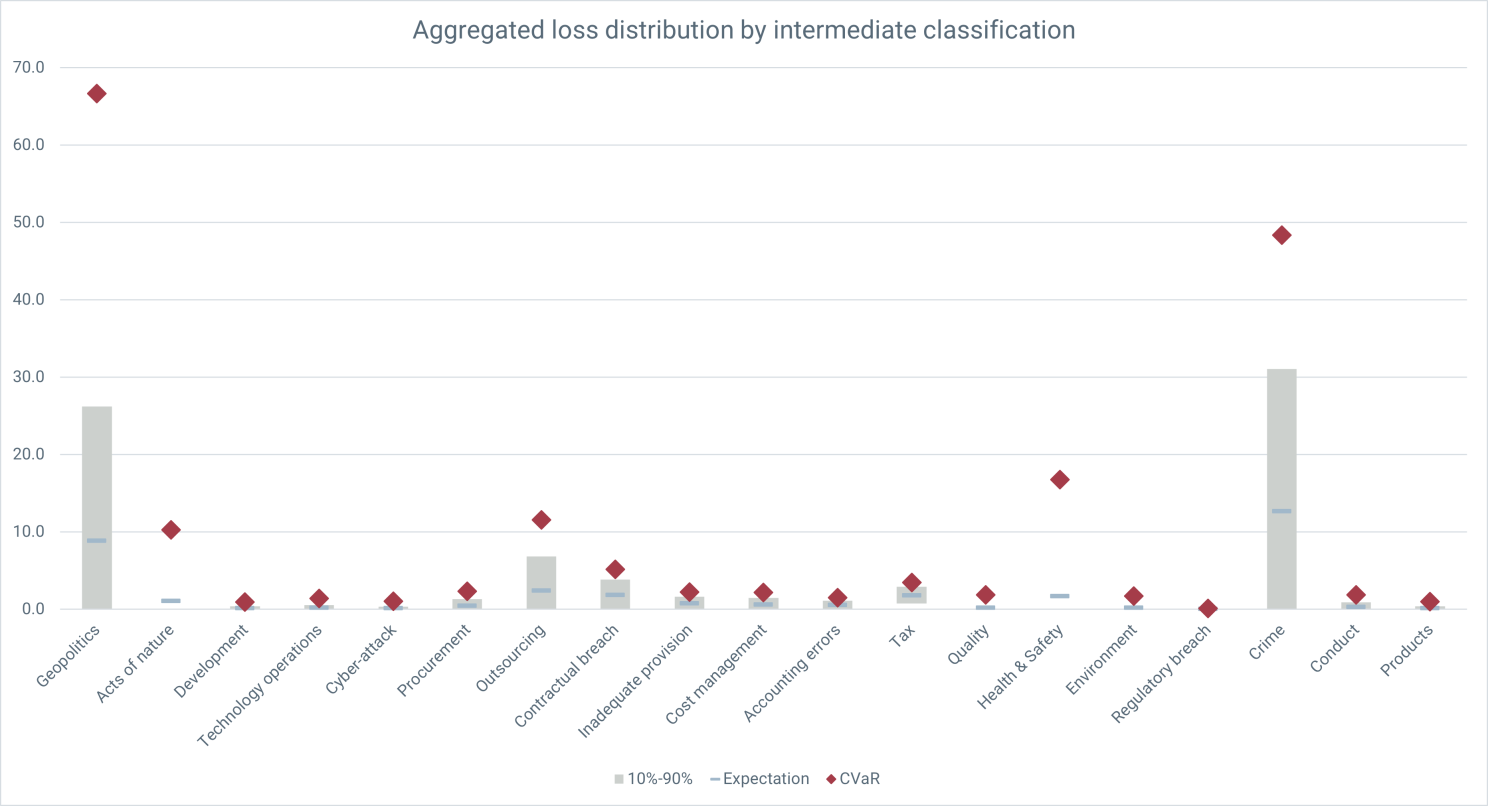
The Compliance sub-categories are regulatory breach, crime, conduct and products. Clearly crime doesn't pay.
All of this insight and information is coming with a couple of clicks in an Excel sheet. (The distributions are recalculated instantly because of the analytical convolution method.) Furthermore, this information is all built out of an extremely simple assessment methodology at the individual risk level, comprising just three numbers corresponding to the questions posed above (and actually two will get you most of the way there)
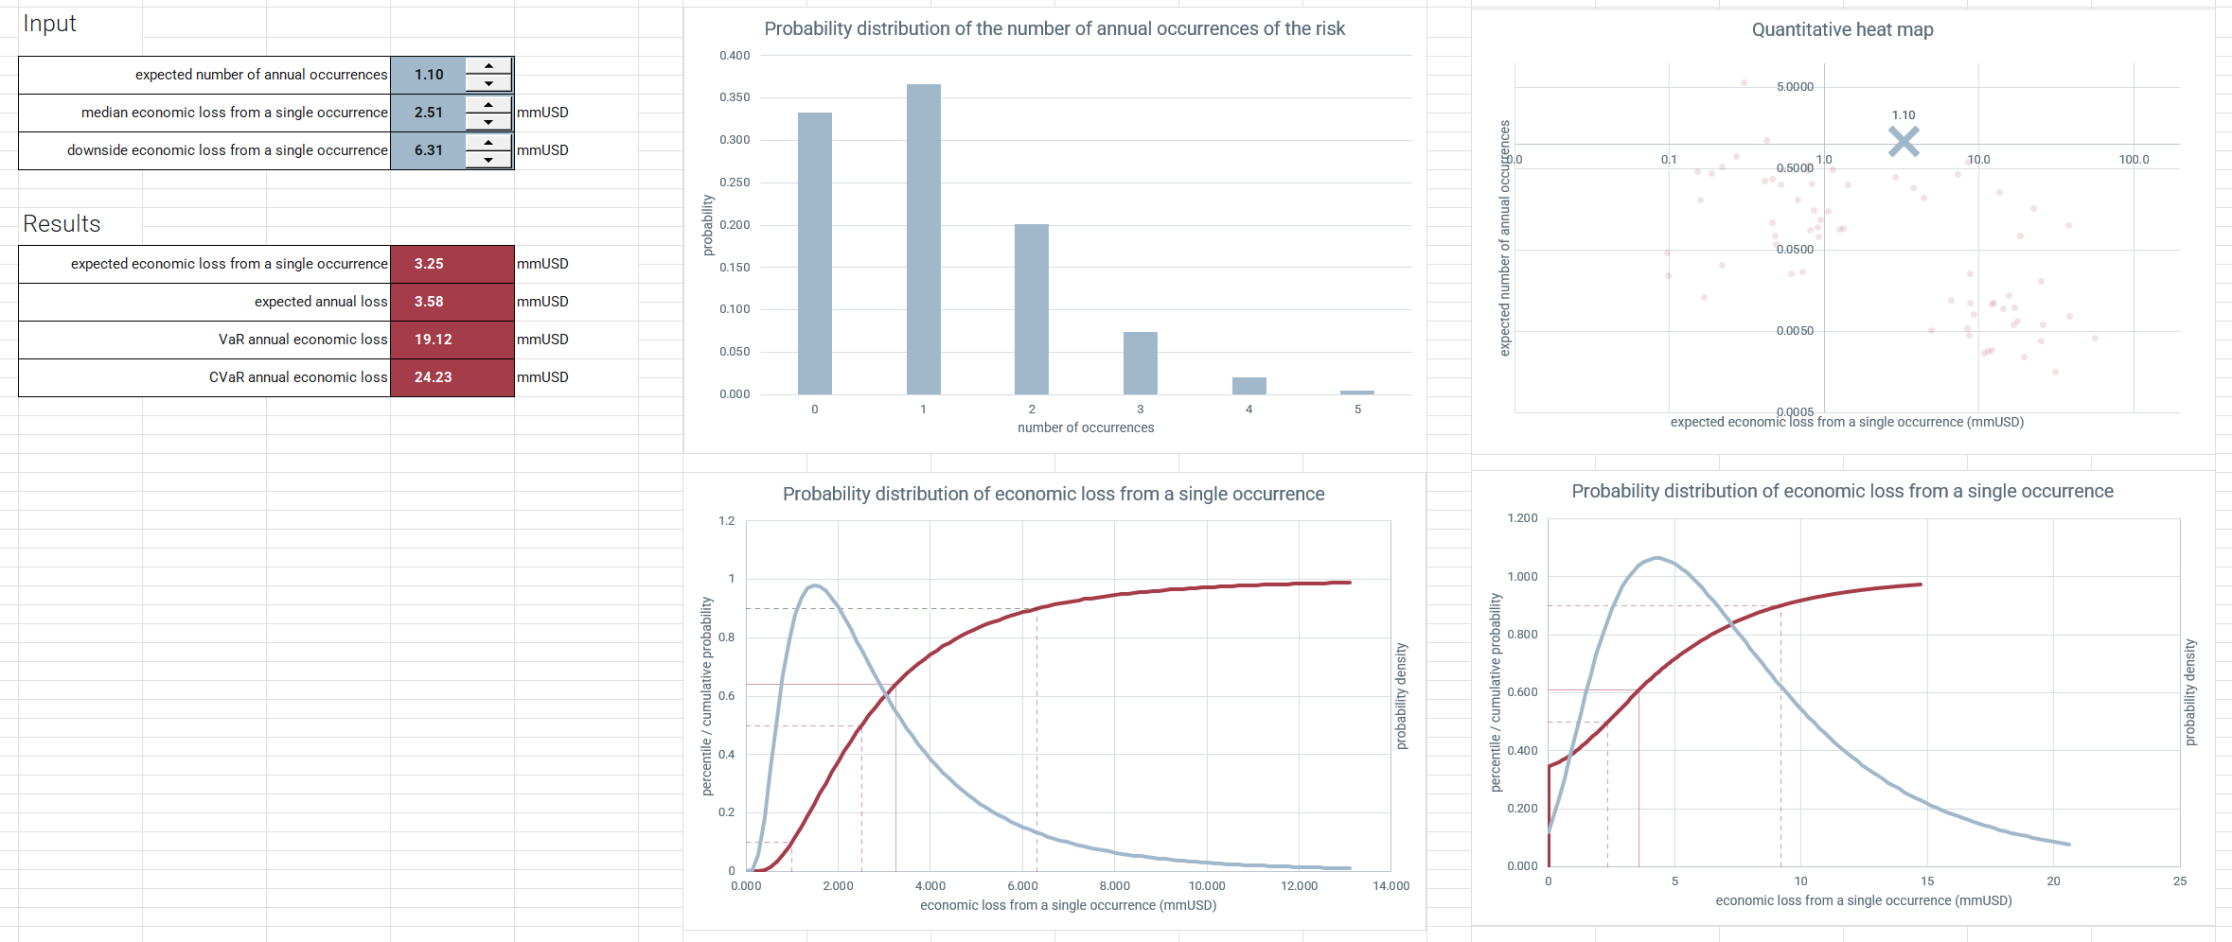
It is a simple matter to build tools that allow SMEs to understand the significance of their choice of parameter in terms of the uncertainty they are trying to represent. For example, this interface shows the uncertainty in both the number of occurrences and the loss per occurrence and allows users to adjust the parameters until those uncertainties correspond to SME intuition on those variables.

Naturally, if data are available, they can be used to provide parameters estimates using a variety of techniques, but the methodology is robust enough to cope with fairly rough estimates on the part of SMEs and yet still provide robust representations of relative contribution to risk exposure at the enterprise level.
Such interfaces can also show annual loss, as well as where the current assessment sits relative to other assessments in chosen categories.
Doug Hubbard likes to tell the joke about two runners out in the woods who come across a bear. The first runner quickly bends down to tighten his shoelaces. The second says "Why bother? You can't outrun a bear", to which the first replies "I don't need to outrun the bear. I just need to outrun you."
We don't need to outrun the bear. We just need to out run risk matrices.
Risk matrices leave the bar incredibly low in terms of risk assessment in the context of Enterprise Risk Management Programs. Even a very simple fully prescribed model, fed with crude SME estimates is a vast improvement. It requires little or no expertise on the part of SMEs, just a little explanation of what the parameters mean and how to set them, and it requires very little modification of a well-structured ERM program.
This is not a replacement for using modeling to provide decision support for individual risks and, indeed, it provides a useful framework for capturing the results of those calculations. But this is a replacement—a straight swap in fact—for meaningless madness with matrices. If you're engaged in this kind of program, just a small modification in your assessment practice can turn a compliance obligation into a massive value opportunity.
The GRC Report is your premier destination for the latest in governance, risk, and compliance news. As your reliable source for comprehensive coverage, we ensure you stay informed and ready to navigate the dynamic landscape of GRC. Beyond being a news source, the GRC Report represents a thriving community of professionals who, like you, are dedicated to GRC excellence. Explore our insightful articles and breaking news, and actively participate in the conversation to enhance your GRC journey.
Sponsored by
