


Apr 18, 2024
Jan 5, 2026
Taking Uncertainty Seriously: Part 2
.svg)

.svg)
Key Takeaways
- Risk Conversations Change When Uncertainty Is Allowed to Exist: Treating risk as a forecast rather than a static register shifts discussions away from labels and toward how the future might actually unfold.
- Single Scores Hide What People Really Disagree About: Collapsing likelihood and impact into one rating masks different mental models of risk, creating false alignment and confusion.
- Separating How Often from How Bad Brings Clarity: Frequency and magnitude are distinct questions about the future, and asking them separately makes assumptions, drivers, and tradeoffs visible.
- Clarity Beats Precision in Early Risk Discussions: Productive conversations don’t require math or models at the outset, just clearer questions about exposure and consequence.
- Better Questions Prepare the Ground for Better Methods: Once frequency and impact are separated, thinking in ranges and exploring uncertainty becomes natural, without forcing complexity too soon.
Deep Dive
In the first essay in this series, I argued that the real difference between qualitative and quantitative risk is how uncertainty is treated. This essay looks at one small distinction that matters once we stop collapsing uncertainty into a single answer.
How Often, How Bad: The Distinction That Changes the Conversation
Once you stop treating risk analysis like an issue register and start treating it like a forecast, the conversation shifts almost immediately. It’s not because you’ve introduced math, or a new framework, or a better tool, but because you’ve allowed uncertainty to stay in the room long enough to be noticed.
At that point, a certain kind of question surfaces and becomes hard to avoid.
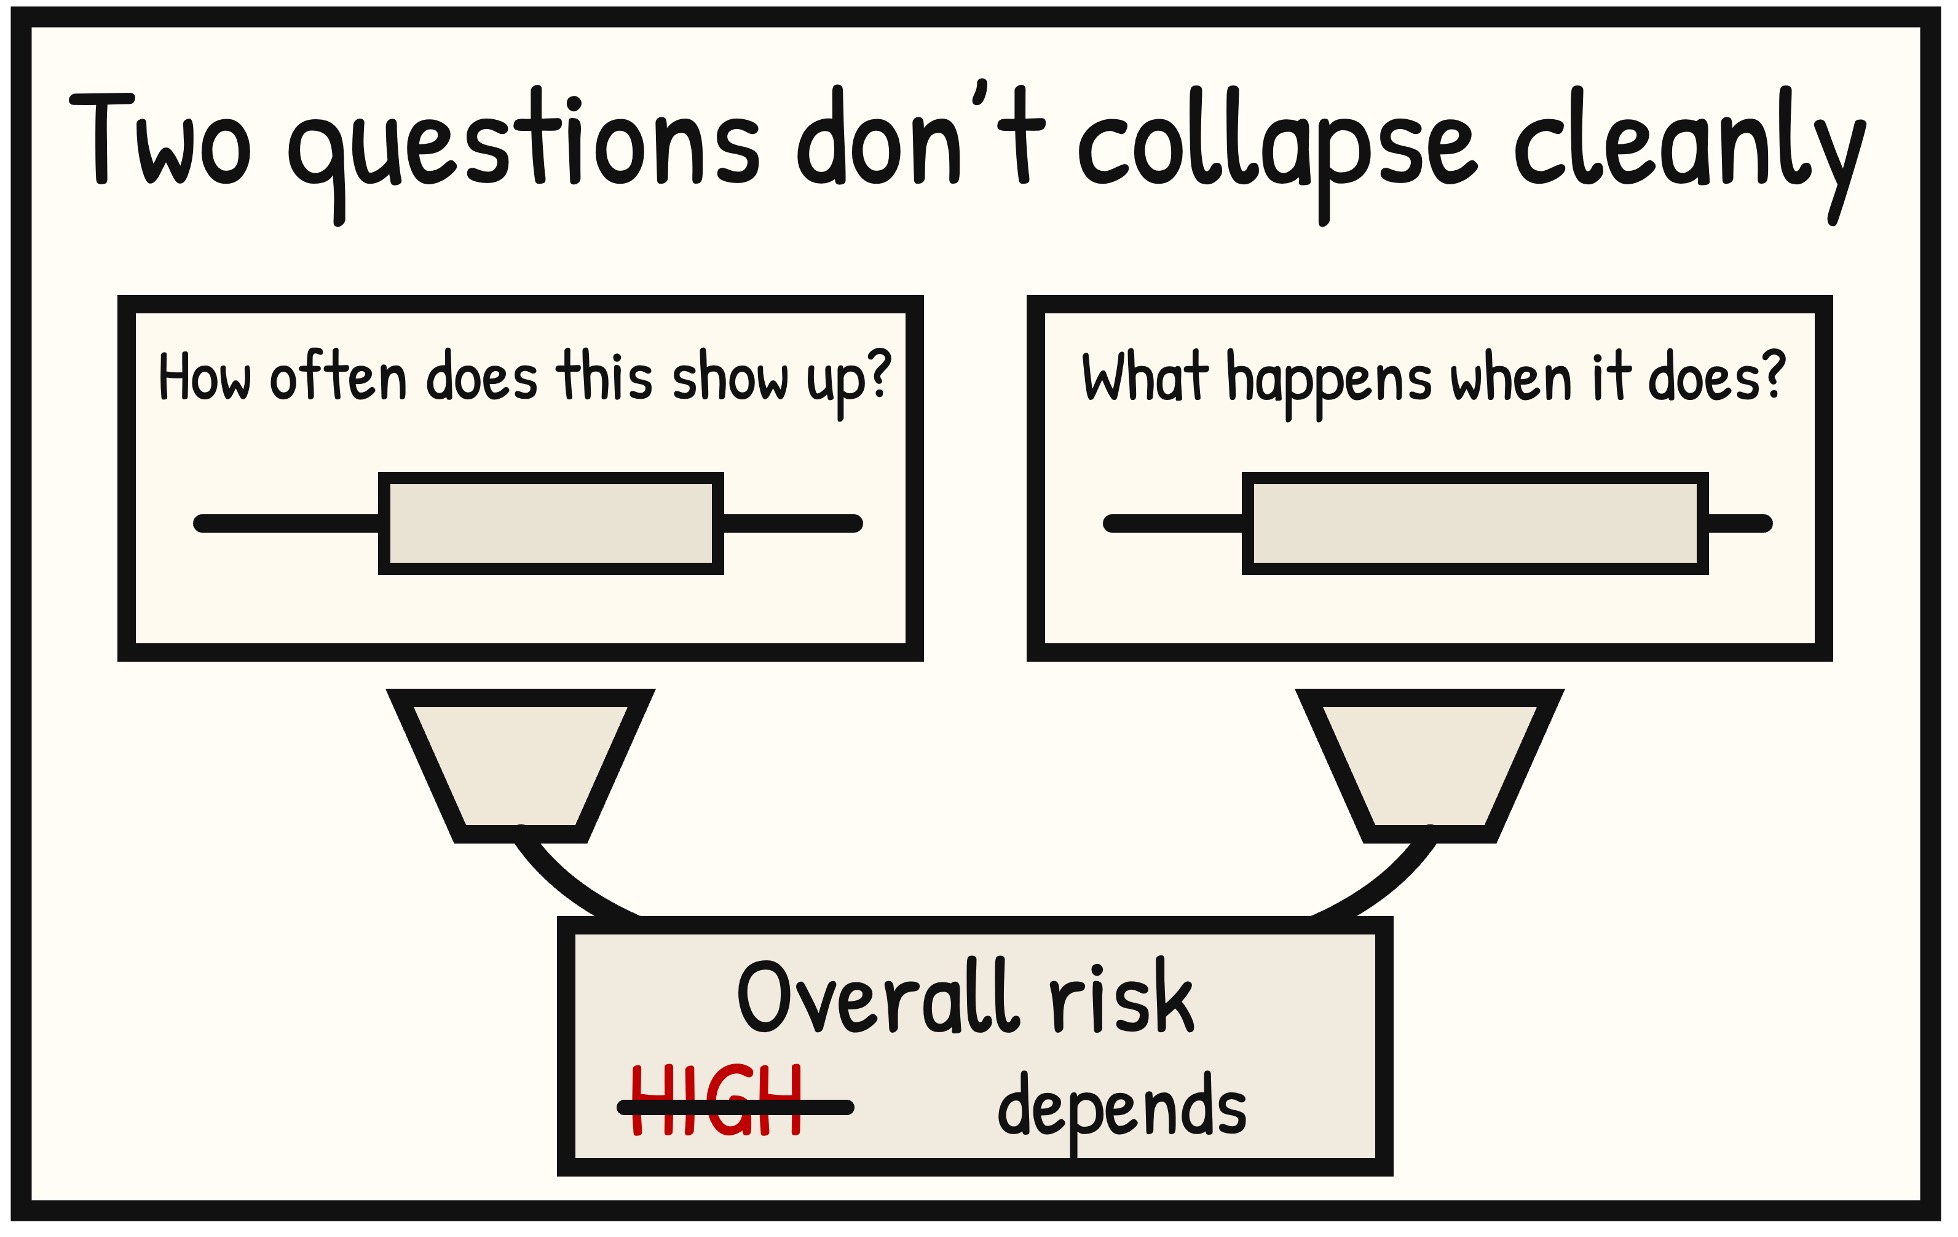
It isn’t technical. It’s closer to an instinct. If this can happen, how often does it happen? And when it does, how bad is it?
What’s interesting is that these questions tend to surface before anyone starts talking about models or methods. They emerge naturally once you stop forcing uncertainty to collapse into a single answer. A range implies spread. Spread invites explanation, and explanation almost always pulls frequency and impact apart, whether you intend it to or not.
Most traditional risk conversations never quite get there. They flatten those two dimensions into a single label and move on. One score, one color, one sense of “severity” that mashes likelihood and impact into something that feels comparable but isn’t.
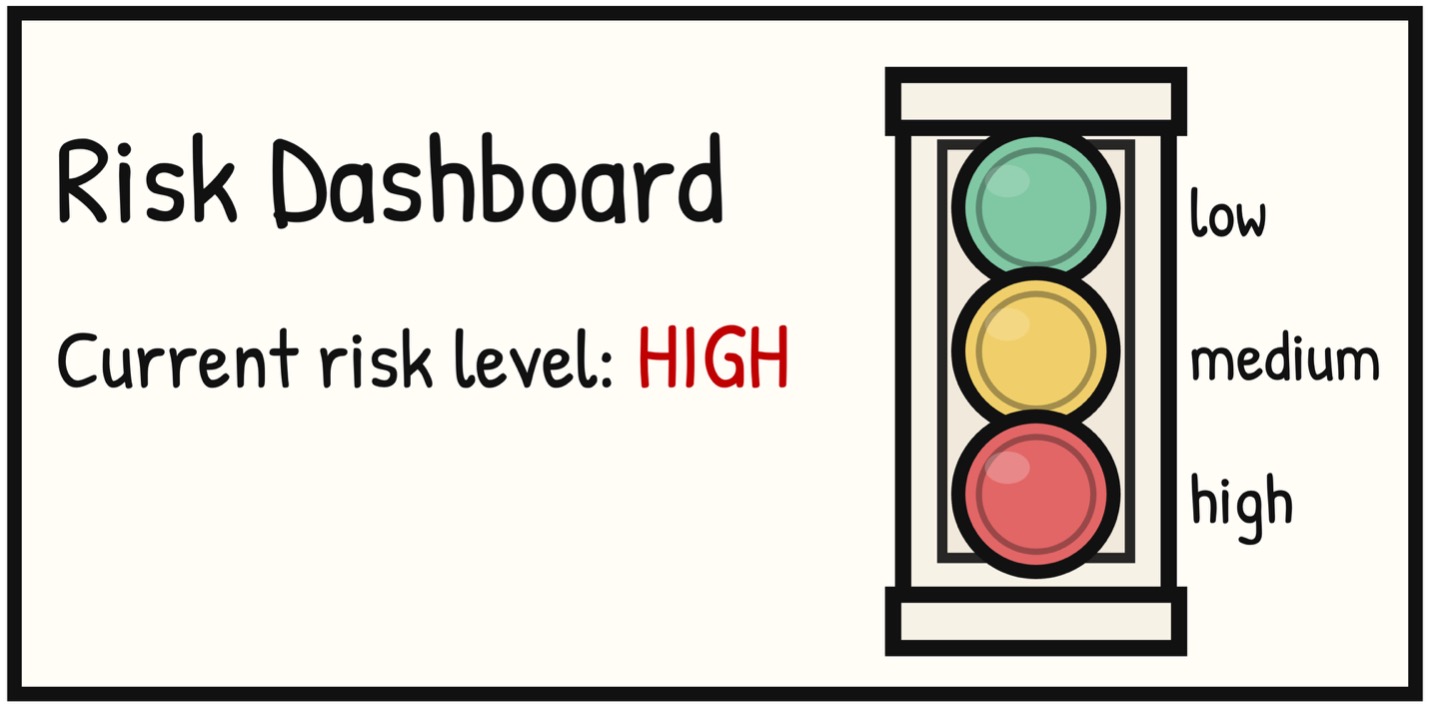
It’s that blending where a lot of confusion lives, and pushback starts.
When people sit down and talk about risk rankings, they’re often not disagreeing about the same thing. One person is picturing something rare but catastrophic. Another is thinking about something frequent but contained. Both might sincerely agree on the label yet mean entirely different futures when they say it.
Separating how often from how bad doesn’t resolve that disagreement, but it finally makes it visible.
This is why the distinction matters even before any math comes into the model. Frequency and magnitude aren’t variables yet; they’re questions. Different questions, aimed at different aspects of the future.
How often is about repetition and exposure. It’s about whether this is the kind of thing that happens frequently enough to blend into everyday operations, or something that only shows up once in a while. How bad is about consequence. It’s about what unfolds when the event occurs, not just the fact that it did.
When those questions are asked separately, the tone of the conversation changes.
People stop arguing about whether a risk is “high” and start talking about what drives it. They stop debating labels and start debating assumptions. Is this something we see every quarter, or something we’ve only seen once in ten years. When it goes wrong, does it cost time and money, or does it force executive attention and external response.
None of that requires precision. It requires clarity.
What’s striking is how often organizations already have strong intuitions about both dimensions, even if they’ve never been asked to articulate them this way. Practitioners know which issues are chronic and which are episodic. They know which failures are survivable and which ones would fundamentally change the conversation with leadership.
Those intuitions just don’t have anywhere to go when everything is flattened into a single score.
Once frequency and magnitude are separated, tradeoffs start to look different. A rare but severe event no longer competes directly with a frequent but modest one on the same scale. They occupy different shapes in the future, and they demand different kinds of responses.
This is also where a lot of frustration with traditional risk assessment methods comes from, even if it’s rarely named. When everything is reduced to one dimension, decisions start to feel arbitrary. Why this risk and not that one? Why now? Why this level of investment? The answers feel unsatisfying because the model can’t express the reasoning that matters.
Separating how often from how bad doesn’t give you the answer. It simply gives you a way to ask better questions.
It also prepares the ground for what comes next, without forcing you there too early. Once you’re thinking in terms of frequency and magnitude, it becomes natural to wonder how those uncertainties interact. How variability compounds. Why worst cases matter even when typical outcomes look manageable.
At that point, single answers stop being very helpful, and thinking in ranges starts to make more sense. Once you start thinking in ranges instead of single answers, the picture changes. You’re no longer reasoning about one future, but rather a space of possible ones. When both how often and how bad are uncertain, it becomes harder to reason about the whole picture at once.
That’s often the point where people reach for simulation. But that’s later.
For now, this distinction does enough work on its own. It takes a future that was previously flattened and gives it shape. It turns vague disagreement into something discussable. It does all of that while staying grounded in judgment and rationality.
In the next piece, we’ll talk about what simulation does in this context, and just as importantly, what it doesn’t do. Not as a prediction engine, but as a way of exploring the shape of risk once uncertainty has been allowed to exist.
Author Bio
Tony Martin-Vegue is an advisor, author, and independent researcher focused on quantitative cyber risk and decision-making under uncertainty. He has worked with Fortune 500 companies and global technology firms to design and operationalize quantitative risk programs, helping organizations move beyond qualitative reporting toward decision-grade risk analysis for executives and boards.
He is the author of the upcoming book From Heatmaps to Histograms: A Practical Guide to Cyber Risk Quantification (Apress, early 2026), which distills lessons from real-world program builds, thousands of risk analyses, and years of applied research into how organizations make risk decisions.
More information and related research can be found at heatmapstohistograms.com.
The GRC Report is your premier destination for the latest in governance, risk, and compliance news. As your reliable source for comprehensive coverage, we ensure you stay informed and ready to navigate the dynamic landscape of GRC. Beyond being a news source, the GRC Report represents a thriving community of professionals who, like you, are dedicated to GRC excellence. Explore our insightful articles and breaking news, and actively participate in the conversation to enhance your GRC journey.
Sponsored by
