


Jul 26, 2024
Nov 25, 2025
The Landscape of Quantitative Risk Modeling
.svg)

.svg)
Key Takeaways
- Risk Modeling Hinges on Ambiguity and Scope: Keith frames quantitative risk modeling around two defining axes, how ambiguous the uncertainty is and how broad the scope of risks being analyzed becomes.
- Most Decisions Don’t Require Perfect Data: The article challenges the myth that uncertainty modeling needs large, high-quality datasets; often only enough information to distinguish outcomes is required.
- Structural Instability Breaks Traditional Models: When systems exhibit feedback loops, nonlinear dynamics, or unstable relationships (as seen in the 2008 crisis), modeling requires entirely different mathematical paradigms.
- Enterprise-Scale Modeling Demands Simplicity and Scale: As organizations broaden from local risks to enterprise-wide portfolios, models must shift from precision toward scalability, prioritization, and governance alignment.
- Resilience Tools Dominate at the High-Ambiguity End: At the far end of the landscape, where chaos, complexity, and unpredictable dynamics exist, scenario analysis and resilience frameworks become more practical than predictive approaches.
Deep Dive
In this article, Graeme Keith expands on the evolving terrain of quantitative risk modeling, charting how ambiguity, complexity, and scope shape the decisions organizations must make in uncertain environments. Building on his earlier work on modeling uncertainty and enterprise-scale decision making, Keith explores the fundamental axes that define the mathematical landscape, unpacking how trends, structural uncertainty, instability, and nonlinear dynamics challenge traditional approaches while revealing where established methods still hold power and where new paradigms are essential.
Understanding the Dynamics Behind Today’s Risk Modeling Landscape
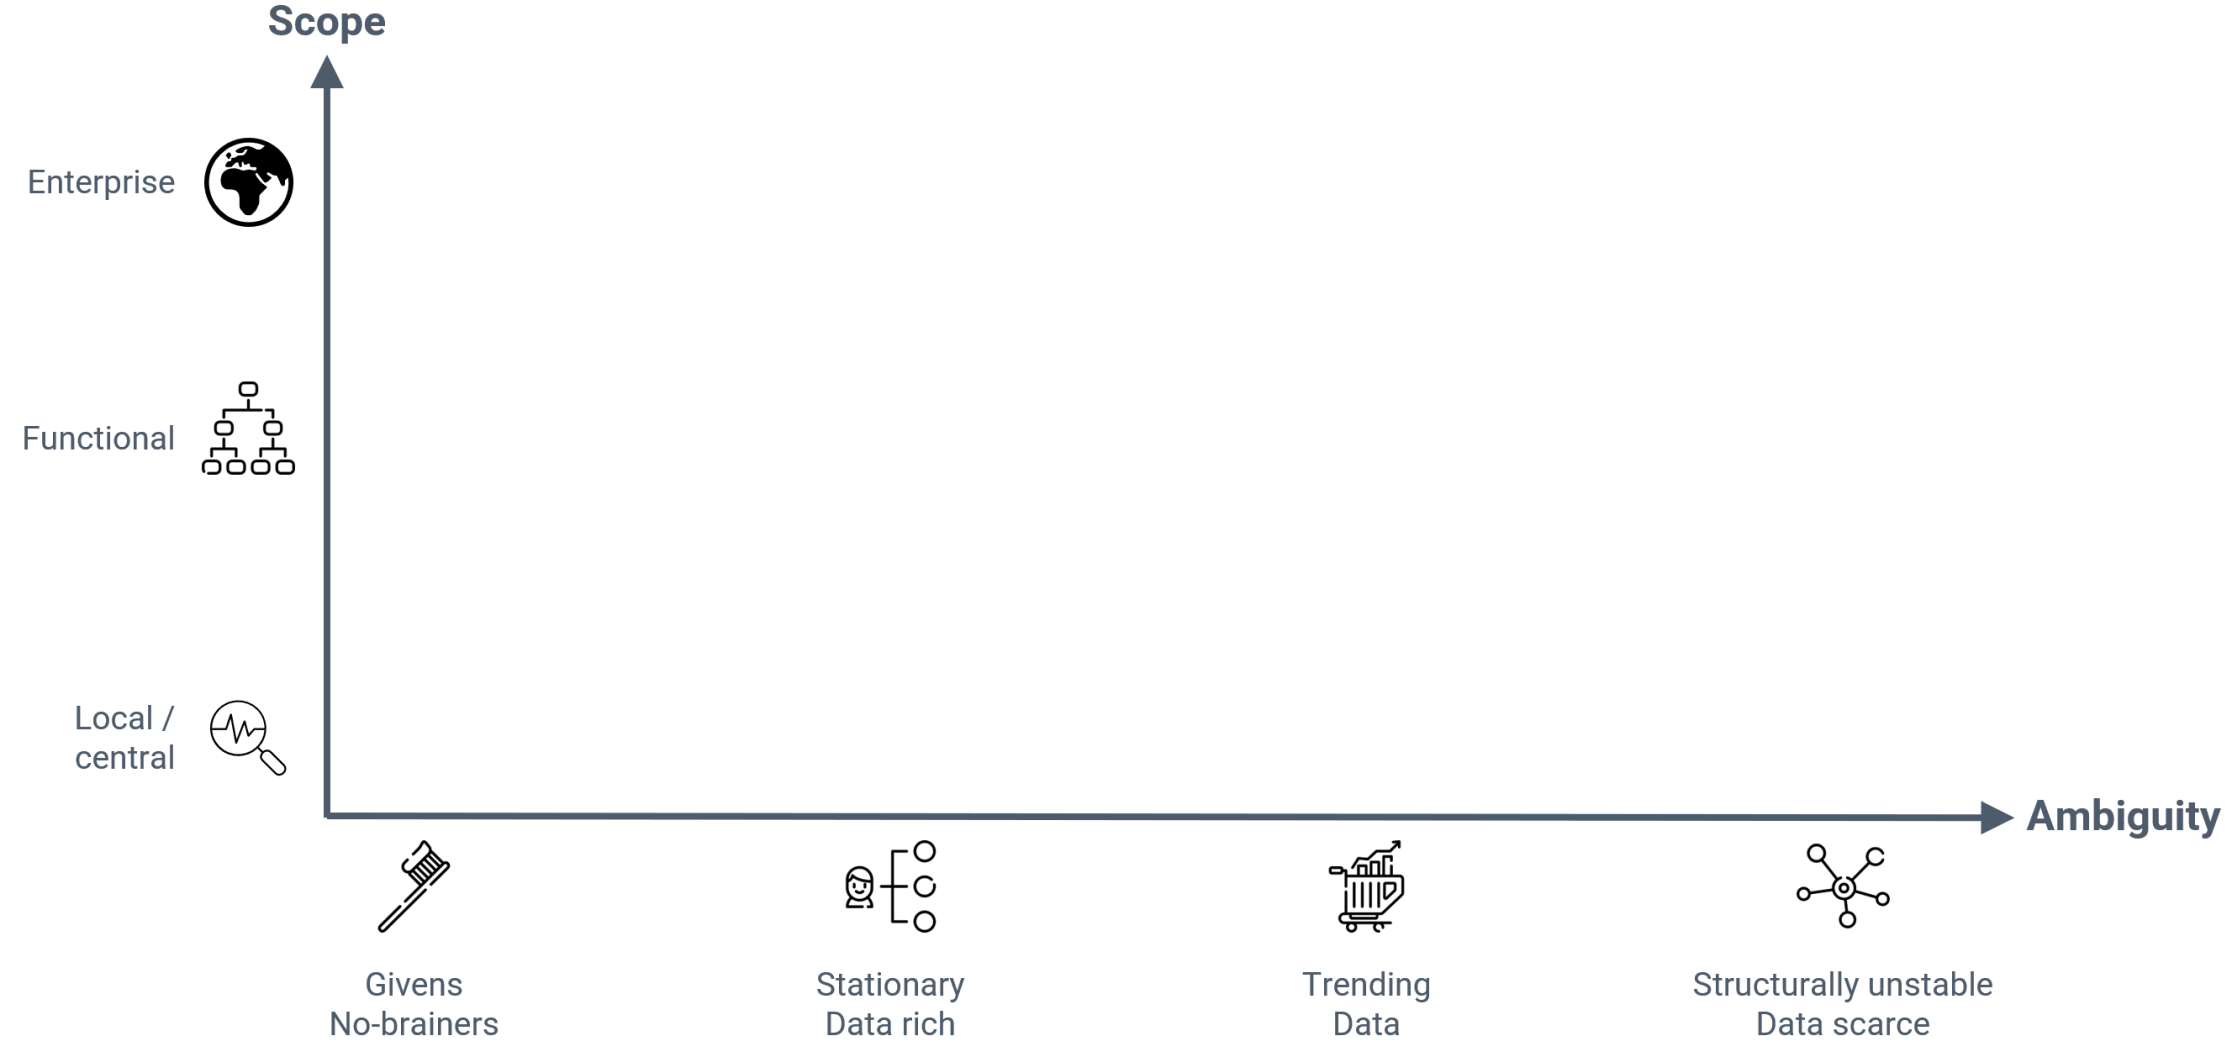
The lines of longitude and latitude on the landscape of quantitative risk modeling are first, what I will call ambiguity, though I might just as well have called it complexity and really it's a combination of both; and secondly, scope, which is related to, but not identical with scale.
So essentially, our territory is charted according to how difficult our decisions are to model and by the scale at which those decisions are made. I will unpack how to interpret these axes—especially the axis of ambiguity—before using them to map the mathematical landscape.
The Axis of Ambiguity
Uncertainty models support decisions by providing information about outcomes related to specific objectives under different decision scenarios. How difficult a decision is to model depends on how hard it is to get the model clearly and unambiguously to show the difference in outcomes. This depends on how hard it is to remove uncertainty in the model—both epistemic and structural—but also on how different are the outcomes.
No-Brainers
The simplest risks to tackle are “no-brainers,” risks whose outcomes under various decisions are so clear that no analysis is really required to make a decision beyond a simple frame.
No-brainers have many forms, but one of the most common is what I call a hygiene risk—a risk that has a substantial downside—maybe not all that likely, but catastrophic in consequence—that is mitigated at such a low cost relative to the downside outcome that it always trivially clear that we should execute the mitigation, whatever tail criterion you have on your decision basis. Brushing your teeth is an example. It’s cheap. If you don’t, your breath will smell and your teeth’ll rot. Many mandatory safety devices—seatbelts, helmets and so on—have this form. Most regulatory risks fall into this category too, regulations effectively acting to remove ambiguity about whether or not we should execute compliance requirements.
Stationary Problems
As soon as there's even a little ambiguity around outcomes, these decisions become harder. We have to weigh off the cost of mitigations against the losses against which we're mitigating and we have to balance the upside reward we're chasing against the downside to which that chase will inevitably expose us.
Now we need a model.
We also need a little data. Very often the amount of data we need to resolve a decision is remarkably little. This is one of the most pernicious myths about uncertainty modeling—the idea that it always requires lots of high-quality, relevant data. Twaddle. We are modeling uncertainty; if we had lots of relevant, high-quality data, we wouldn’t have any uncertainty and we wouldn’t need an uncertainty model. We are not looking for perfection because we are only looking to be able to differentiate outcomes—separate the uncertainties enough so that the correct decision becomes clear.
However much data you need, however, we do have to be able to get it fast enough. There are two components to this. The first is logistical, do we have the time and resources to get hold of sufficient data to support the decision. Notwithstanding we often need much less than we think, considerations around systematization of data collection can be extremely powerful in this context. The second component is more fundamental.
Are the data we gather still going to be relevant over the timescale we are going to apply them? Does the future we’re conditioning resemble the past on which we’re conditioning it? Why might it not? Essentially, the background assumptions of our model might change or the model itself might have its own inherent dynamics. We'll take these in turn.
Trending
Trending is the extrinsic evolution of context. Trends can be more or less predictable. Things like computing power, battery capacity, cost of wind power and so on follow fairly clearly defined empirical trends—again we have to be careful about the time we’re extrapolating from and into, but nonetheless, these are often utilizable as essentially deterministic trends.
Then we have stochastic trends like living costs, which have an underlying trend structure, but also a fair amount of noise and the possibility for critical events that introduce structural changes in the evolution.
And finally we have truly stochastic time series like market and commodity prices. With both these latter, it’s usually better to try and incorporate the uncertainty into the model, because those uncertainties are an integral part of the uncertainty against which we’re trying to make a decision.
Such an integration or model extension is one way models themselves can become dynamic. Many models will have some kind of inbuilt, often implicit time dependence—things like wear—the more you use something the less efficient it becomes (though you can also build the opposite—learning—into a model). Picking through a finite resource—say developing a mine or picking sites for wind farms—will often have a time-dependence that comes about because you will go for the highest grades and pick the best sites first.
None of this is particularly pernicious. You just have to go in with your eyes open and think about what you’re modeling.
What really undoes this kind of modeling and forces you along the axis of ambiguity into a completely different paradigm is when the dynamics you have between variables in a model are potentially unstable. Where the uncertainty is structural as well as epistemic.
Instability and Chaos
So far, we are using historical data to predict not what will happen, but the probability distribution over what might happen. We can do this because we assume that the statistics of what has gone before is a guide to the uncertainty around what will happen in the future. We then extend this by tracking the way the statistics of uncertainties in the model depend on specific extrinsic variables. But if the variables themselves have some kind of intrinsic time dependence connected to the uncertainties in the model then suddenly things get rather more complicated.
Here’s an example from the 2008 finance crisis. Real estate prices are on the rise, so banks are calm about lending money to people buying houses—because real estate prices are on the rise and they reckon on having good collateral. People—all sorts of people—borrow, because they can. They buy houses and, lo, house prices go up and we’re back to real estate prices going up.
This is grand. For a bit. The problem is the cycle can also go the other way. If banks start getting a bit wobbly about making loans then the market stagnates, or worse begins to turn. Then not only does borrowing confidence and thus borrowing and purchasing fall—leading to further collapse in prices, but people start calling in the loans, selling the collateral and putting further downward pressure on prices.
This kind of system, which in its early manifestation can be mistaken for a system with an extrinsic trend, needs a whole new modeling paradigm. They are dominated—at these timescales—by their dynamics, so we’re looking at dynamic systems theory encompassing stability, structural stability, nonlinear dynamics and in some cases chaos.
In reality these methods are only really useful for essentially quite simple systems with only a few degrees of freedom. For more complex systems we’re into complexity models, networks, dynamic networks and the like. Our analysis is structural, rather than predictive—even stochastically predictive—and our response tools are now firmly over in the resilience camp and not so much in the realm of contingency planning.
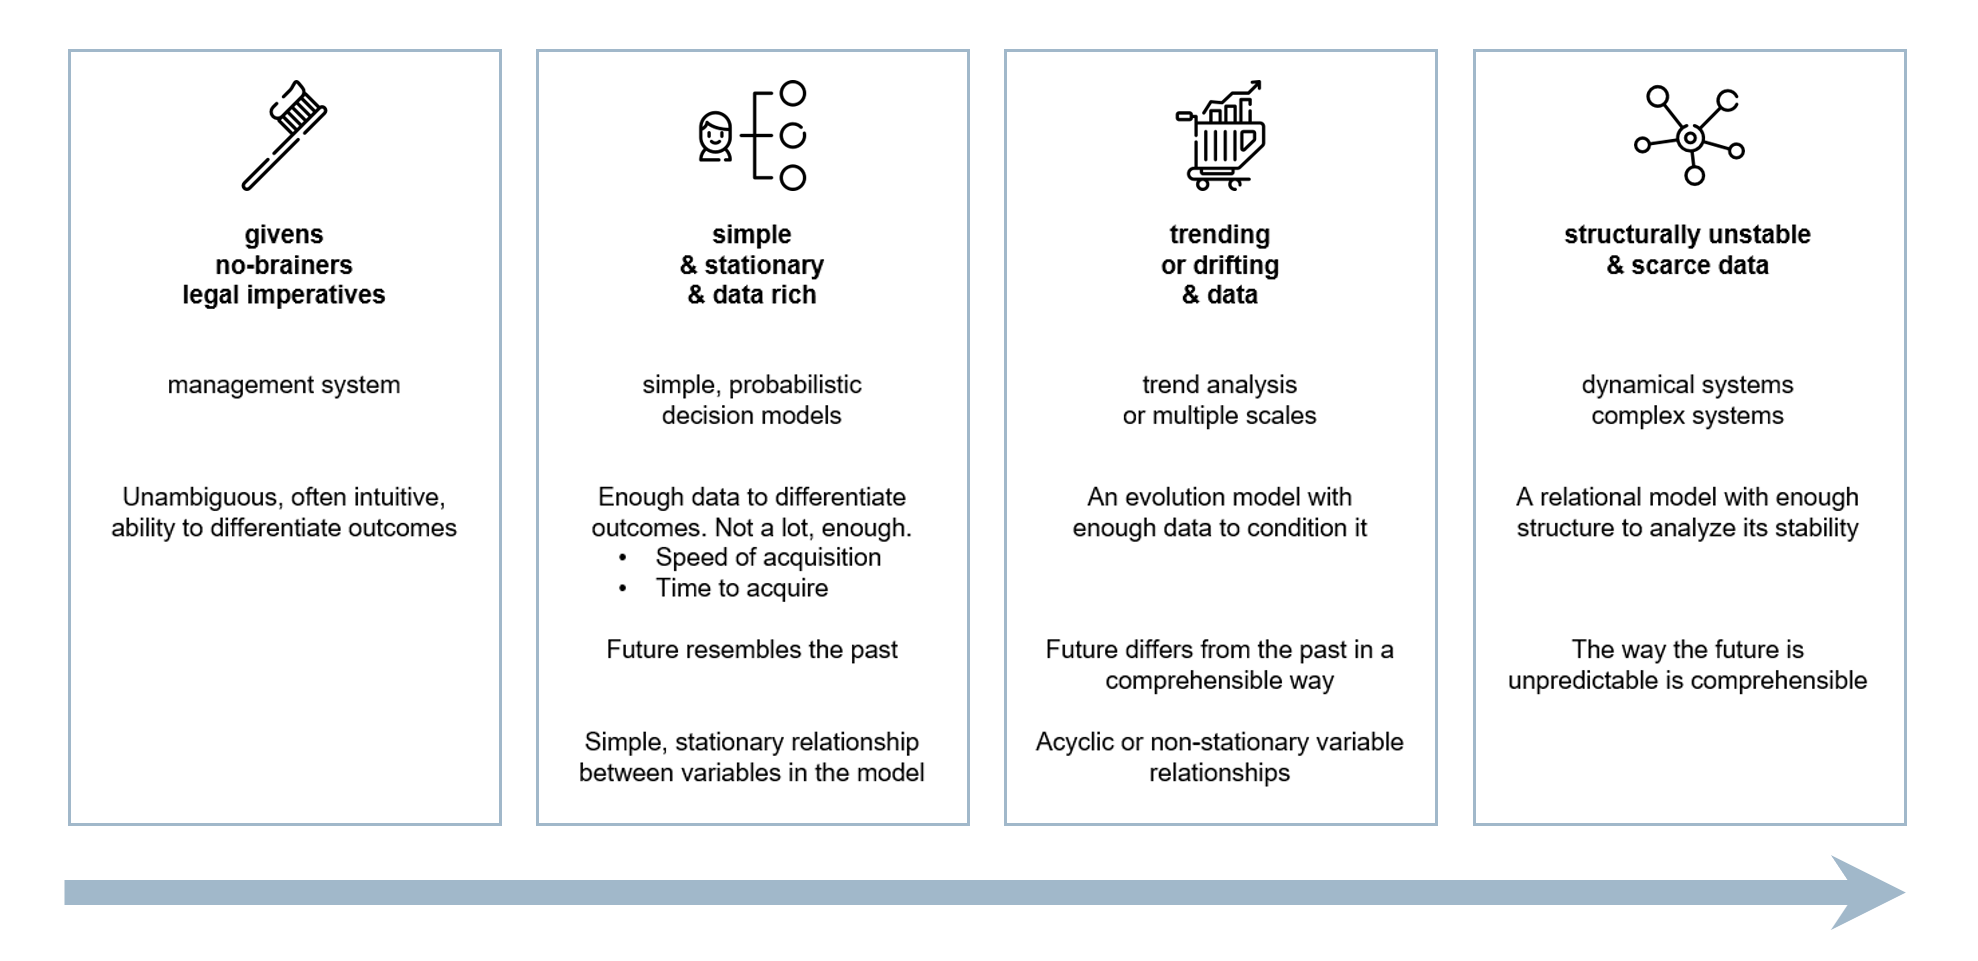
The axis of ambiguity is summarized in the picture above.
The Axis of Scope
The axis of ambiguity is not the whole story. It matters whether we are applying our model to a single uncertainty or a small cluster of related uncertainties or whether we're trying to tackle broader scopes of risk.
The axis of scope starts with local analysis. Local doesn't necessarily mean trivial (or parochial), just that we're only looking at a single isolated uncertainty or cluster of uncertainties. At the other end of the axis we have full Enterprise scale—lots and lots of uncertainties of all forms and kinds.
In the middle we might expect to find large clusters and small enterprises, but a more fruitful midway between these extremes is large collections of identical or structurally similar risks. Here we have some of the scope of the Enterprise scale, but we are restricted to particular forms or types of risk, which allows for careful systematization, automation and scale. Many of the established modeling traditions sit in this space, investment portfolios, credit risk portfolios, insurance, cyber-risk (arguably) and so on.
The Landscape of Structural Analytical Modeling
Over on the left, we have the givens, the no-brainers. This is the realm of compliance. The lower left is the corner of common sense. As we expand in scope, the execution becomes more complex. This is where GRC platforms have their place: essentially making sure everyone brushes their teeth. There's not much value here, because we're not so much influencing decision making as making sure it's executed properly.
Back to the base again, but sliding over towards the right, we move into the realm of statistical or probabilistic decision modeling. The future resembles the past, at least historically. Simple framing and a bit of structure to capture relevant information can yield substantial value through the kinds of decision integration I described in my previous article on How to Model Risk. This region is surprisingly broad and rich in unexplored value. Analyses are fairly limited in scope and the analyst is working closely with risk owners and decision makers, who ultimately need to own the models on the basis of which they make their decisions.
Much established modeling tradition is essentially built from this approach, scaled to encompass large portfolios of similar risks. Credit risk, investment risk, insurance and so on. The value here is manifest, but far from unexplored.
As the scope increases further to encompass a broader variety of risk types, we move into Quantitative Enterprise Risk Management, which I described in my article last week. Enterprise Risk includes both local analysis of risks with broad impact (belonging at the base of the chart), but also large-scale analyses of risks that can be managed at scale. Here the emphasis moves away from the individual risks (which must be assessed as simply as possible to deliver at the required scale) and towards consideration of how to prioritize between classes of risk or between different broad areas of application.
Returning once more to the base, and once more sliding to the right, we start getting into more sophisticated mathematical analyses incorporating trend analysis, stochastic processes and time-series analysis. Much of the most sophisticated modeling work in application today comes where these methods are applied at a portfolio level, but at the Enterprise level, we must be content to try to understand the complex interactions if not necessarily capture all the dynamic interactions that would be required for predictive analytics.
Finally, as we approach the right-hand edge of the map, we find the kind of highly nonlinear behavior whose analysis bears fruit in small degree of freedom systems, but for which we are firmly in the realm of scenario analysis and resilience frameworks.
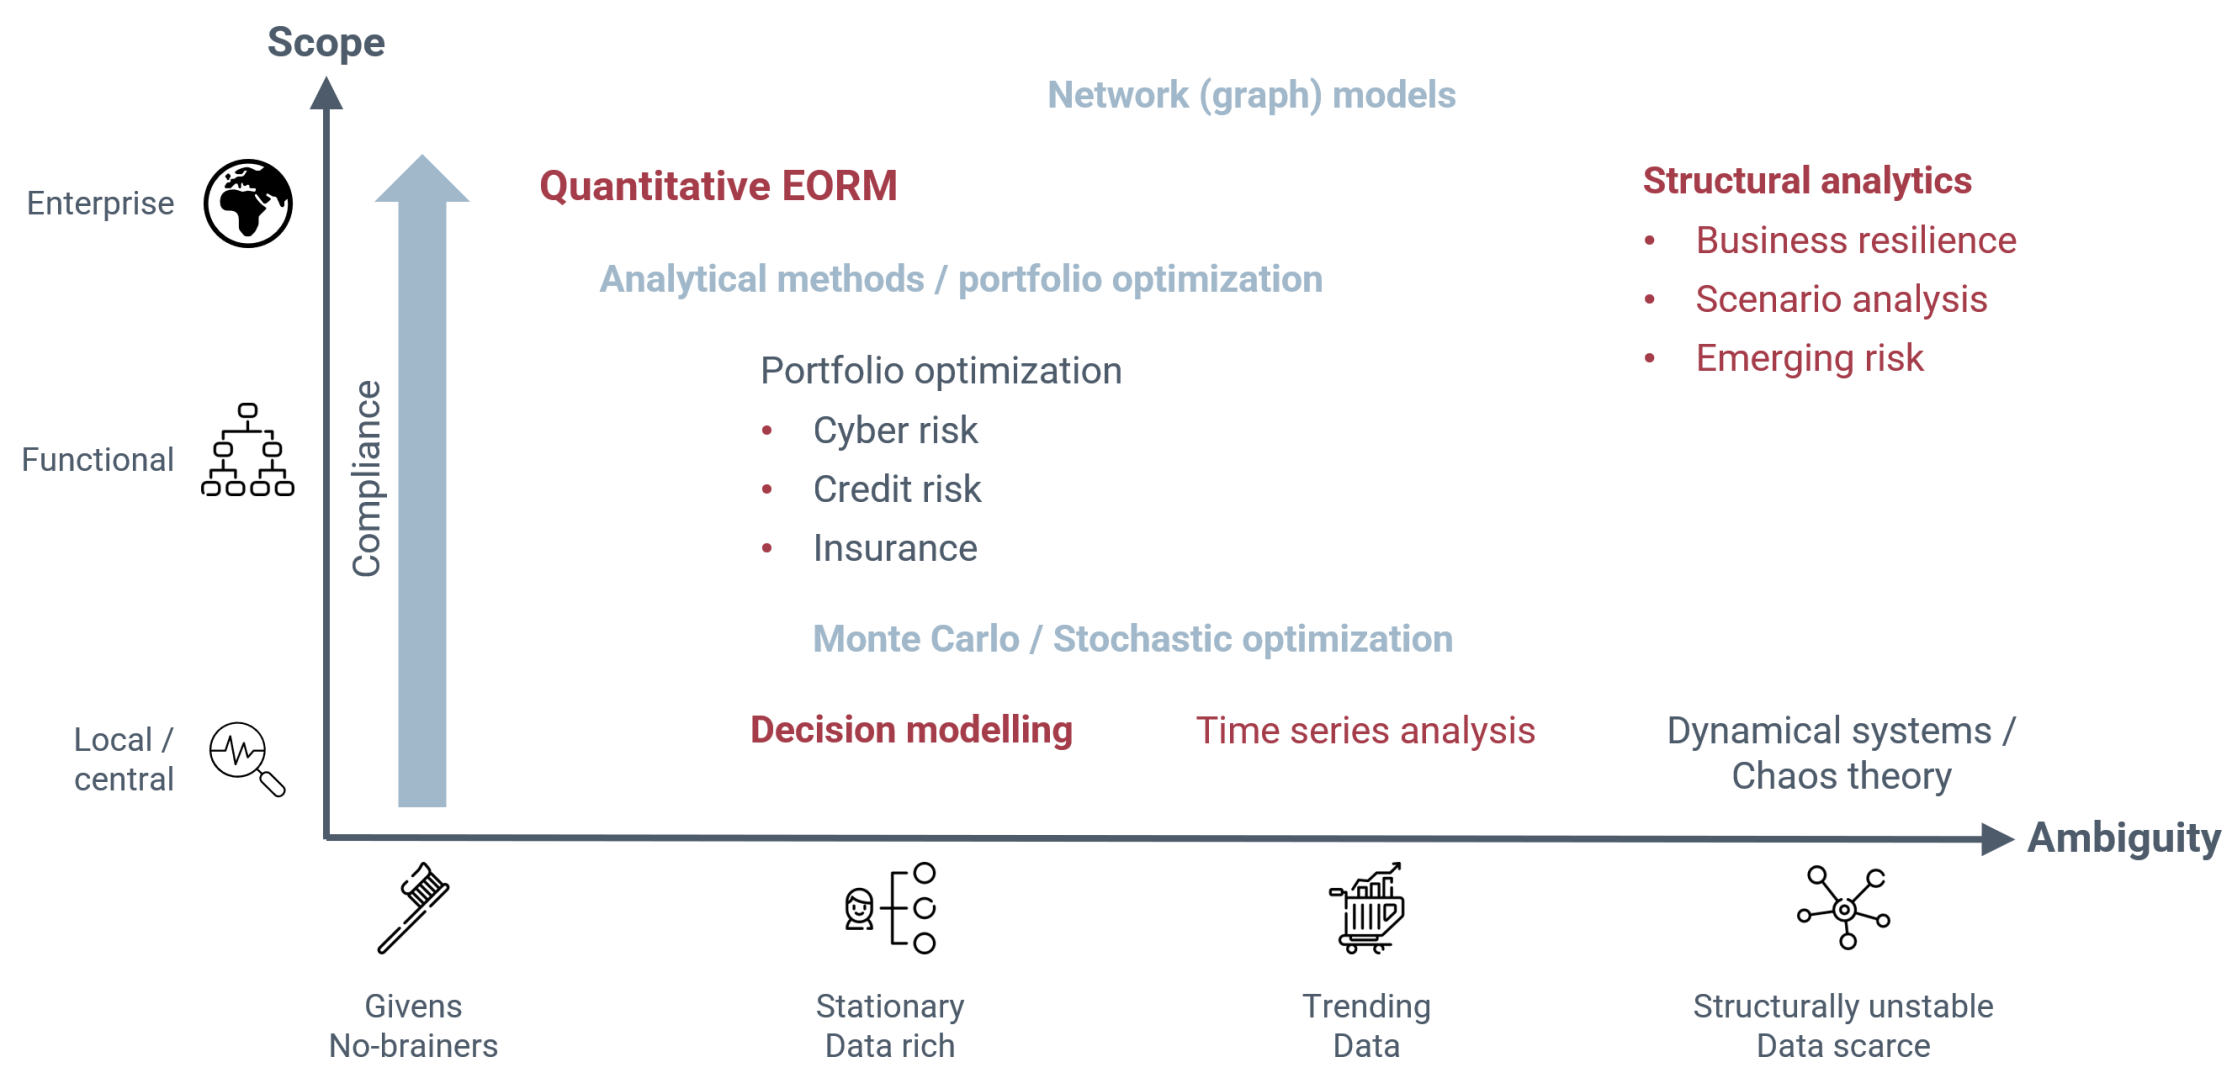
The landscape is set out above. Many of the struggles we have in the realm of quantitative risk modeling can be seen as misapplication of methods. Many famous modeling failures are essentially stationary and trending models applied to structurally unstable systems. The whole tension between resilience monitor-and-adapt paradigms and more traditional predict-and-plan approaches can be seen more simply as a question of the rate at which you can turn over relevant data compared to how quickly systems evolve and—possibly—turn unstable. Quantitative ERM was developed to address the fact that traditional quantitative approaches belong at the base of the chart and fail to address the governance and enterprise-scale decision making with which ERM is traditionally concerned.
The GRC Report is your premier destination for the latest in governance, risk, and compliance news. As your reliable source for comprehensive coverage, we ensure you stay informed and ready to navigate the dynamic landscape of GRC. Beyond being a news source, the GRC Report represents a thriving community of professionals who, like you, are dedicated to GRC excellence. Explore our insightful articles and breaking news, and actively participate in the conversation to enhance your GRC journey.
Sponsored by
